

Imagine you’re trying to figure out what a rare trading card is worth. You wouldn’t just look at one price online, right? You’d check recent sales, compare similar cards, maybe see what experts predict. Investors do the same thing with companies, but instead of eBay, they use a powerful tool called the Football Field Valuation. And yes, it’s named after the sport!
Forget the Grass, Focus on the Goalposts: What is a Football Field Chart?
Picture a football field (the American kind!). Now, imagine the yard lines aren’t for running plays, but for stock prices. The left end zone might be $50 per share, the right end zone might be $150 per share. Your job as an analyst? To figure out where the current stock price sits on that field, and more importantly, where all the different valuation methods think it should be.
Why Bother? The Problem with Single Answers
Valuing a company isn’t simple math. Ask 5 analysts, you might get 5 different answers! Why?
- Different Tools, Different Views: Some analysts swear by Discounted Cash Flows (DCF – valuing future money). Others rely on comparing similar companies using multiples like P/E ratios (Price-to-Earnings). Each method has strengths, weaknesses, and makes different assumptions.
- “Fair Value” is Fuzzy: There’s no single “correct” price. It’s a range based on perspective.
The Football Field tackles this head-on. It doesn’t force one answer; it shows you the whole playing field of possibilities.
Building the Field: How It Works (Simplified!)
Think of it as creating a visual summary of every major valuation technique applied to one company:
Step I. Gather Your Valuations: An analyst calculates the company’s value using several key methods:
- Comparable Companies (“Comps”): “If Company X is worth $100/share based on its profits, and our company is similar, maybe it’s worth $110?”
- Precedent Transactions: “What did buyers actually pay for similar companies recently?”
- Discounted Cash Flow (DCF): “What’s the total value of all the cash this company is expected to generate in the future, brought back to today’s dollars?”
- Dividend Discount Model (DDM): “What’s the value of all the future dividends (if it pays them)?”
- Leveraged Buyout (LBO) Analysis: “What would a private equity firm likely pay, based on debt and returns?”
- Target Prices: What other analysts covering the stock predict.
Step II. Plot the Points: Each valuation method spits out a specific price per share or a range of prices. These get plotted as vertical bars (like yard markers) across the football field (the price axis).
Step III. Spot the Current Price: A clear line (or a small bar) marks the stock’s current market price on the same field.
Step IV. See the “Field”: Voila! You now see a chart with multiple bars at different price points, representing the different valuation outcomes, spread across the “field.” The current price sits somewhere in this landscape.
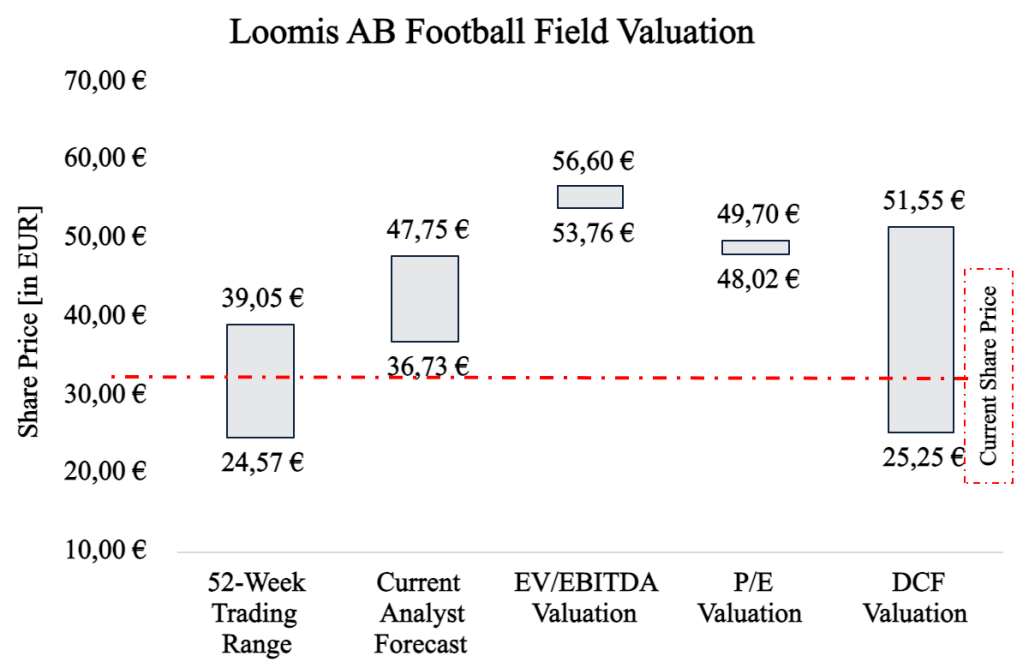
Below is an illustration of Loomis AB 2025 Football Field Valuation. Your homework is to analyze it. Put your thoughts in the comment section!
Reading the Play: What Does the Football Field Tell You?
- Consensus Check: Are most valuation bars clustered together? That suggests stronger agreement on fair value. Are they spread wide apart? More uncertainty.
- Upside/Downside Potential: How far is the current price from the lowest valuation bar? (Potential Downside). How far is it from the highest bar? (Potential Upside).
- Relative Position: Is the current price near the “cheap” end of the field (left side) or the “expensive” end (right side)? Is it sitting comfortably in the middle of the pack?
- Method Comparison: Which valuation methods give higher or lower results? Why might that be? (e.g., DCF might be optimistic about future growth, while Comps might reflect current market pessimism).
Why It’s Great for Beginners:
- Visual & Intuitive: No complex formulas needed upfront! You see the big picture instantly.
- Embraces Uncertainty: It shows valuation isn’t black-and-white, preparing you for real-world investing.
- Highlights Key Tools: Introduces you to major valuation methods (DCF, Comps, etc.) in a practical context.
- Focuses on Range: Teaches you to think in terms of a reasonable price range, not a single magic number.
- Context for Current Price: Shows if the market price looks cheap, expensive, or fair relative to the various analyses.
The Final Whistle: Don’t Bet the Farm Just Yet!
The Football Field is a starting point, not the final playbook. Remember:
- Garbage In, Garbage Out: If the inputs to the valuations (assumptions, comparable companies) are flawed, the field will be misleading.
- It’s a Snapshot: Valuations change as new information (earnings, news, market sentiment) emerges.
- Context Matters: The field doesn’t tell you why valuations differ. You still need to understand the underlying business and the assumptions behind each bar.
So, next time you hear about a stock price, think like an analyst: Don’t just see the number on the screen. Imagine the whole football field behind it! Understanding where that price sits among the various valuation “goalposts” gives you a much deeper, more nuanced view of whether it might be a potential opportunity or a risky punt.


Leave a comment